Cómo instalar el agente de Pandora FMS (Pandora FMS Agent) en un equipo con sistema operativo Linux Ubuntu Server 22. Cómo configurar la conexión con el servidor de Pandora FMS y visualizar los módulos que se monitorizan por defecto.
- Actualizar los paquetes del SO Linux Ubuntu Server 22.
- Instalar Pandora FMS Agent en Linux Ubuntu Server 22.
- Configurar Pandora FMS Agent para conexión con Pandora FMS Server y establecer datos del agente.
- Ejemplo de fichero pandora_agent.conf completo para Linux.
Actualizar los paquetes del SO Linux Ubuntu Server 22
Siempre que se va a realizar una instalación de un paquete, es recomendable actualizar los paquetes actuales del sistema operativo. Realizaremos esta operación con precaución si tenemos algún software que requiera de versiones específicas de los paquetes base.
Para actualizar Linux Ubuntu Server 22, en primer lugar actualizaremos la lista de paquetes disponibles a la última versión, con el comando:
|
1 |
sudo apt-get update |
Si hay paquetes para actualizar, ejecutaremos este otro comando para actualizarlos a la última vesión:
|
1 |
sudo apt-get upgrade |

Instalar Pandora FMS Agent en Linux Ubuntu Server 22
La instalación del agente de Pandora FMS en Linux Ubuntu Server 22 es muy sencilla, únicamente tendremos que ejecutar el siguiente comando:
|
1 |
sudo apt-get install pandorafms-agent |
Nos pedirá confirmación para instalar, introduciremos «s» y pulsaremos INTRO. Si no queremos recibir confirmación, añadiremos -y al comando anterior.
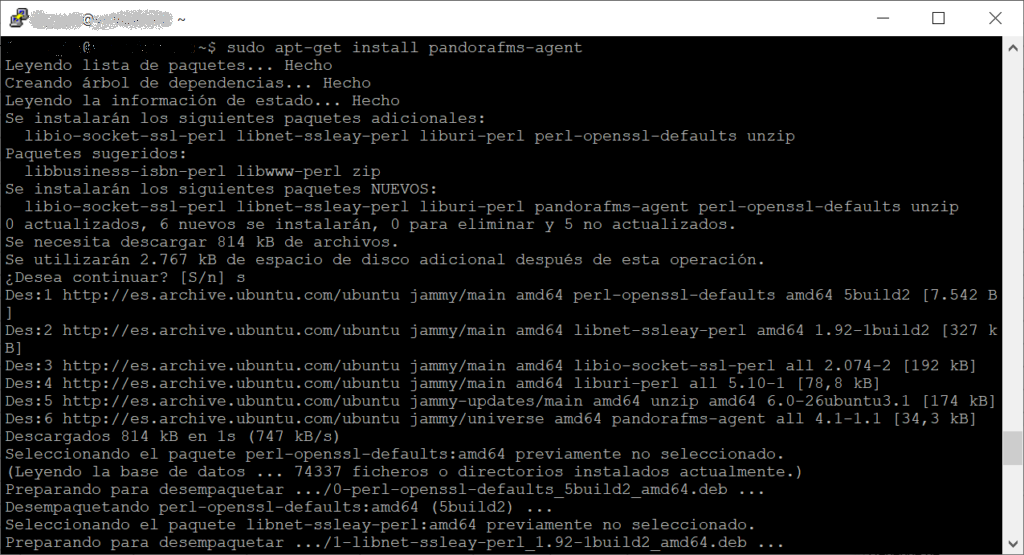
Se instalará el agente de Pandora FMS en pocos segundos. El servicio de Pandora FMS aún no se iniciará y es lo que queremos, dado que antes de iniciarlo hay que configurar la conexión con el servidor de Pandora FMS y otros parámetros, como explicamos a continuación.
Configurar Pandora FMS Agent para conexión con Pandora FMS Server y establecer datos del agente
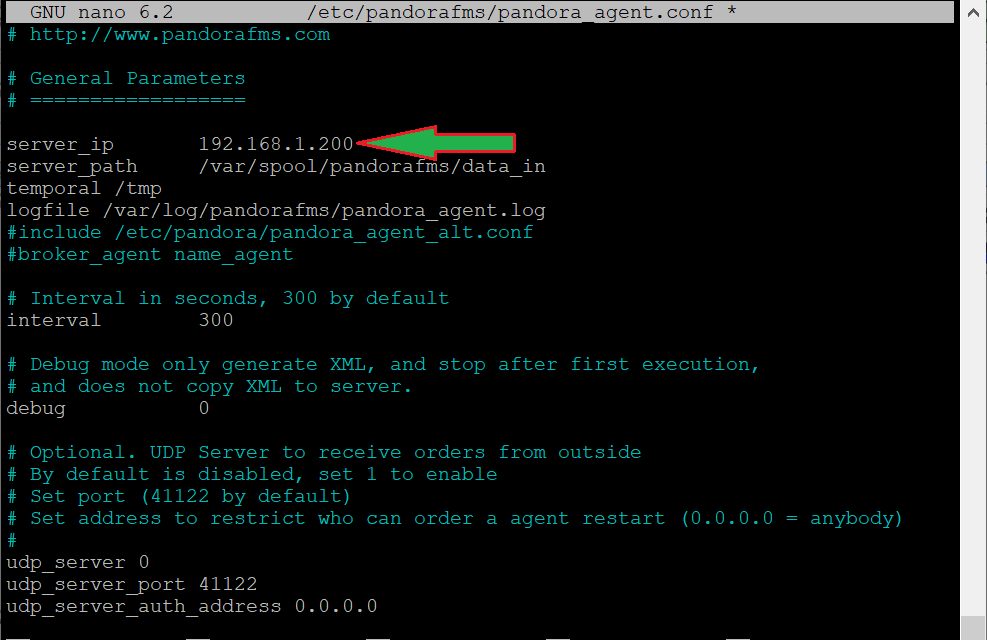
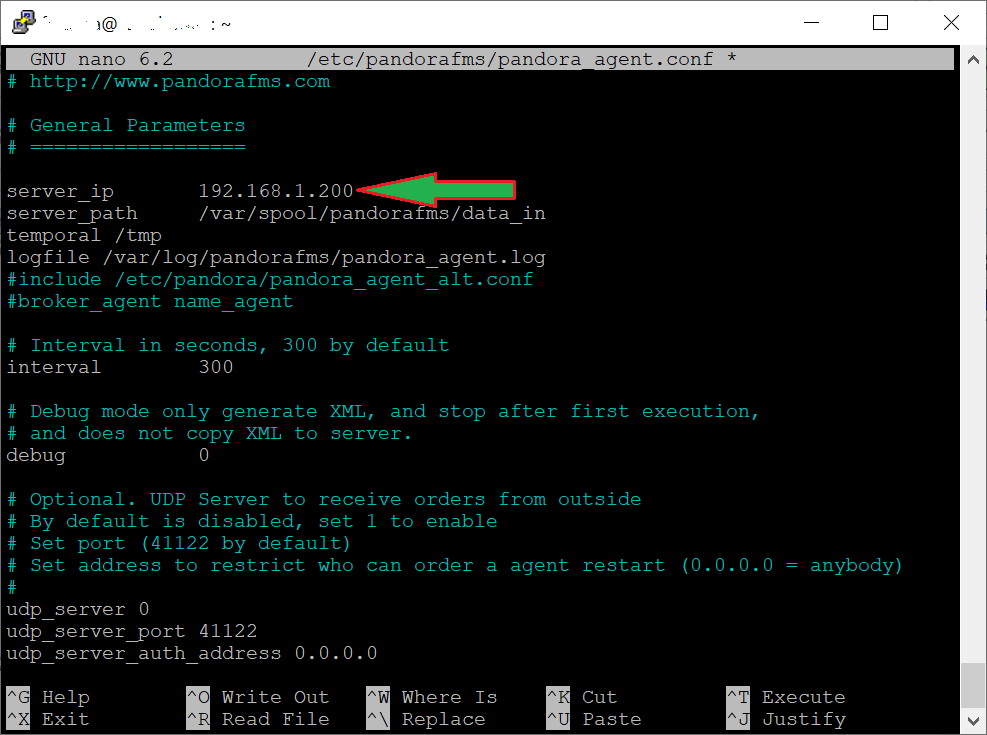
Antes de iniciar el servicio de Pandora FMS Agent, editaremos el fichero de configuración, para establecer los datos del agente y la conexión con el servidor de Pandora FMS Server. Para ello, editaremos el fichero /etc/pandorafms/pandora_agent.conf, con el comando:
|
1 |
sudo nano /etc/pandorafms/pandora_agent.conf |
Estableceremos el valor de los siguientes parámetros (en muchos dejaremos el valor por defecto):
- server_ip: uno de los parámetros más importantes, indicaremos en este parámetro la dirección IP del servidor Pandora FMS Server. Este será el dato que Pandora Agent use para la conexión con el servidor.
- server_path: dejaremos el valor por defecto /var/spool/pandorafms/data_in.
- temporal: dejaremos el valor por defecto /tmp.
- logfile: dejaremos el valor por defecto /var/log/pandorafms/pandora_agent.log.
- interval: el intervalo de conexión con el servidor para actualizar los datos de los módulos. Por defecto 300 segundos (5 minutos).
- debug: dejaremos el valor por defecto 0.
- agent_name: si dejamos comentada esta línea (por defecto), se cogerá como nombre del agente el nombre DNS del equipo. Si queremos establecerlo manualmente, descomentaremos esta línea y añadiremos el nombre para el agente en Pandora FMS Server.
- description: descripción que se añadirá al agente para facilitar su identificación.
- address: si dejamos el valor por defecto auto, se asignará la dirección IP actual del equipo al agente. Si queremos especificarla manualmente, cambiaremos «auto» por la dirección IP del equipo Linux a monitorizar.
- server_port: el puerto de conexión con el servidor de Pandora para envío de los datos de los módulos del agente, por defecto el 41121.
- transfer_mode: el modo de envío de los datos, por defecto tentacle.
Existen más parámetros, pero los anteriores son los más importantes, el resto los dejaremos al valor por defecto.
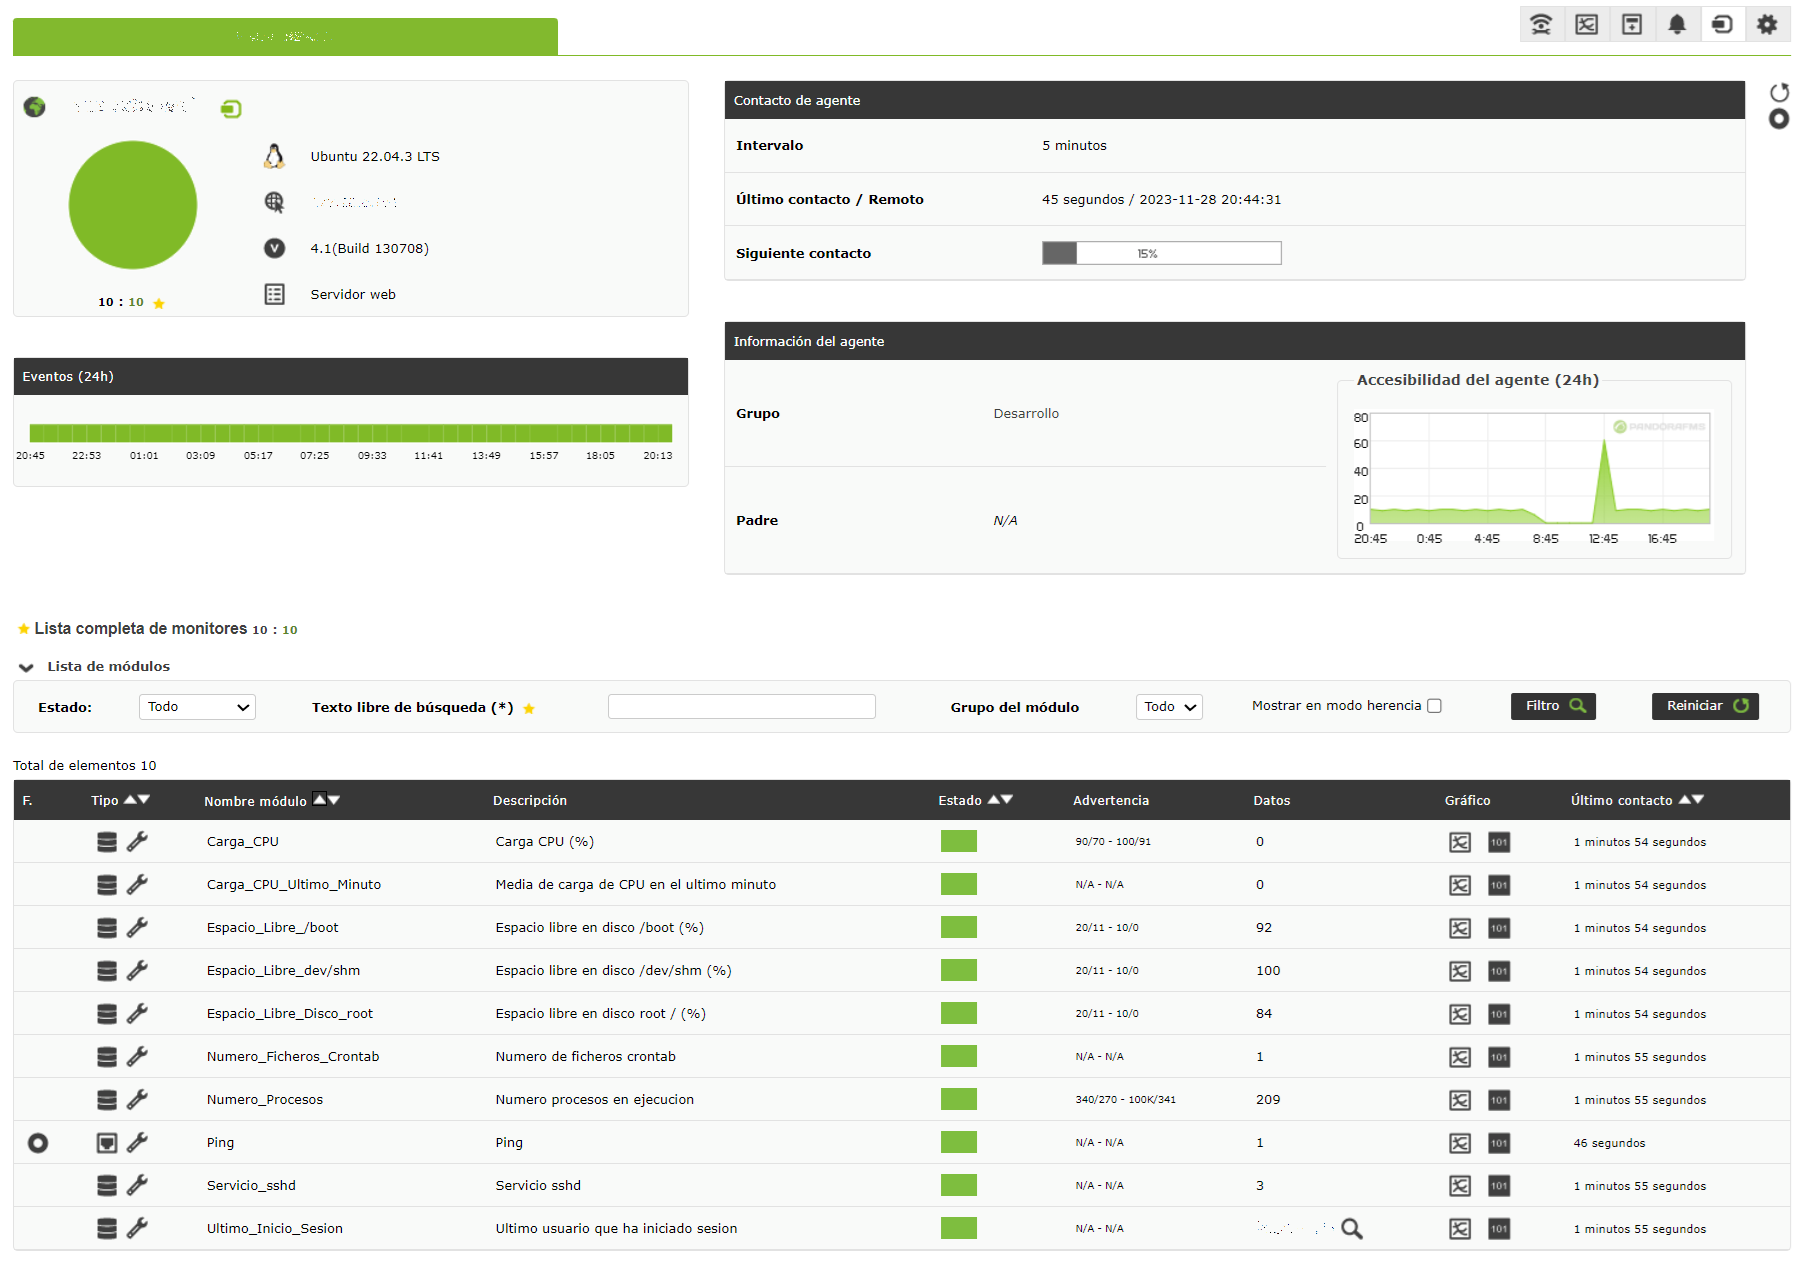
Tras los parámetros de configuración, en el mismo fichero pandora_agent.conf, se indican los módulos (sensores, sondas, monitores), que serán los encargados de obtener la información del equipo Linux Ubuntu Server, tales como la carga media de la CPU en el último minuto, la carga de CPU actual (porcentaje de uso de CPU), el último usuario que inició sesión, el número de procesos total en ejecución, el número de ficheros crontab, si el servicio SSH está activo, porcentaje de uso de espacio en disco, etc. Como vemos, se trata de módulos de ejemplo, que podemos modificar y quitar o añadir, para personalizarlos a nuestro gusto.
Por ejemplo, un listado de módulos en Linux personalizados podría ser (deben estar en el fichero pandora_agent.conf):
|
1 2 3 4 5 6 7 8 9 10 11 12 13 14 15 16 17 18 19 20 21 22 23 24 25 26 27 28 29 30 31 32 33 34 35 36 37 38 39 40 41 42 43 44 45 46 47 48 49 50 51 52 53 54 55 56 57 58 59 60 61 62 63 64 65 66 67 68 69 70 71 72 73 74 75 76 77 78 79 80 81 82 83 84 85 86 87 88 89 90 91 92 93 94 95 96 97 98 99 100 101 102 103 104 105 106 107 108 109 110 111 112 113 114 115 116 117 118 119 120 121 122 123 124 125 126 127 128 129 130 131 132 133 134 135 136 137 138 139 140 141 142 143 144 145 146 147 148 149 150 151 152 153 154 155 156 157 158 159 160 161 162 163 164 165 166 167 168 169 170 171 172 173 174 175 176 177 178 179 180 181 182 183 184 185 186 187 188 189 190 191 192 193 194 195 196 197 |
# Module Definition # ================= # System information # vmstat syntax depends on linux distro and vmstat command version, please check before use it module_begin module_name Carga_CPU module_type generic_data module_interval 1 module_exec vmstat 1 2 | tail -1 | awk '{ print $13 }' module_max 100 module_min 0 module_description Carga CPU (%) module_min_warning 70 module_max_warning 90 module_min_critical 91 module_max_critical 100 module_unit % module_end #Get load average module_begin module_name Carga_CPU_Ultimo_Minuto module_type generic_data module_exec cat /proc/loadavg | cut -d' ' -f1 module_description Media de carga de CPU en el ultimo minuto module_end #Get free memory in MB #module_begin #module_name Memoria_Cache_Libre #module_type generic_data #module_exec free -m | grep buffers/cache | awk '{print $4}' #module_description Memoria cache libre (MB) #module_min_warning 500 #module_max_warning 600 #module_min_critical 100 #module_max_critical 499 #module_unit MB #module_end # Memoria RAM Libre (%) module_begin module_name Memoria_RAM_Libre module_type generic_data module_exec free | grep Mem | awk '{ printf("%.0f", $4/$2 * 100.0) }' module_max 0 module_min 100 module_description Memoria RAM libre (%) module_min_warning 150 module_max_warning 30 module_min_critical 16 module_max_critical 0 module_unit % module_end #Count total number of processes module_begin module_name Numero_Procesos module_type generic_data module_exec ps -A | tail --lines=+5 | wc -l module_description Numero procesos en ejecucion module_min_warning 270 module_max_warning 340 module_min_critical 341 module_max_critical 99999 module_unit procesos module_end # Process information module_begin module_name Servicio_sshd module_type generic_proc module_exec ps -Af | grep sshd | grep -v "grep" | wc -l module_description Servicio sshd module_end # Async data example module_begin module_name Ultimo_Inicio_Sesion module_type async_string module_exec last | head -1 module_description Ultimo usuario que ha iniciado sesion module_end # Module that get the number of cron file # This module uses a precondition, if cron is running the # module will check the folder /etc/cron.d to get the number of files module_begin module_name Numero_Ficheros_Crontab module_type async_string module_precondition =~ .*cron.* ps aux | grep cron module_exec ls -l /etc/cron.d | awk 'NR>1 {print $0}' | wc -l module_description Numero de ficheros crontab module_unit files module_end # Plugin example # This plugin detects all disk partitions and monitor the free spaces #module_plugin pandora_df # This parses /var/log/syslog file, under the module name "syslog" # And search for "ssh" string into it, sending only that information. #module_plugin grep_log /var/log/syslog Syslog ssh # Get disk space free in % / module_begin module_name Espacio_Libre_Disco_root module_type generic_data module_exec df -kh / | tail -1 | awk '{ print 100-$5 }' module_max 100 module_min 0 module_description Espacio libre en disco root / (%) module_min_warning 11 module_max_warning 20 module_min_critical 0 module_max_critical 10 module_end # Get disk space free in % /dev/shm module_begin module_name Espacio_Libre_dev/shm module_type generic_data module_exec df -kh /dev/shm | tail -1 | awk '{ print 100-$5 }' module_max 100 module_min 0 module_description Espacio libre en disco /dev/shm (%) module_min_warning 11 module_max_warning 20 module_min_critical 0 module_max_critical 10 module_end # Get disk space free in % /boot module_begin module_name Espacio_Libre_/boot module_type generic_data module_exec df -kh /boot | tail -1 | awk '{ print 100-$5 }' module_max 100 module_min 0 module_description Espacio libre en disco /boot (%) module_min_warning 11 module_max_warning 20 module_min_critical 0 module_max_critical 10 module_end #This module uses postprocess feature to unit conversion module_begin module_name Memoria_RAM_Usada_MB module_type generic_data module_exec free -k | grep buffers/cache | awk '{print $3}' module_postprocess 0,000976 module_description Used memory in KB postprocessed to be in MB module_end # Plugin for inventory on the agent (Only Enterprise) # module_plugin inventory 1 cpu ram video nic hd cdrom software init_services filesystem users process ip route # Example of preconditions #module_begin #module_name Test Precondicion #module_type generic_data #module_precondition < 10 echo 5 #module_precondition > 10 echo 15 #module_precondition = 10 echo 10 #module_precondition != 10 echo 5 #module_precondition =~ 10 echo 10 #module_precondition (5,15) echo 10 #module_freepercentmemory #module_description Precondition test module #module_end # Example of postconditions #module_begin #module_name Test Postcondicion #module_type generic_data #module_condition < 10 echo min >> /tmp/log.txt #module_condition > 3 echo max >> /tmp/log.txt #module_condition = 5 echo equal >> /tmp/log.txt #module_condition != 10 echo diff >> /tmp/log.txt #module_condition =~ 5 echo regexp >> /tmp/log.txt #module_condition (3,8) echo range >> /tmp/log.txt #module_exec echo 5 #module_description Postcondition test module #module_end |
Una vez configurados los parámetros y los módulos en el fichero pandora-agent.conf, iniciaremos el servicio de Pandora Agent, desde la línea de comandos, ejecutando:
|
1 |
/etc/init.d/pandorafms-agent |
El nombre del proceso puede variar según la versión de Pandora FMS Agent o de Linux. Para localizarlo, podemos ejecutar el siguiente comando:
|
1 |
ls -lah /etc/init.d/pandora* |
Que nos devolverá el fichero de inicio del servicio de Pandora:
/etc/init.d/pandorafms-agent
Transcurridos unos segundos, el nuevo agente aparecerá en la consola web de Pandora FMS Server:
Ejemplo de fichero pandora_agent.conf completo para Linux
Un ejemplo del contenido del fichero pandora_agent.conf completo para equipos con Linux:
|
1 2 3 4 5 6 7 8 9 10 11 12 13 14 15 16 17 18 19 20 21 22 23 24 25 26 27 28 29 30 31 32 33 34 35 36 37 38 39 40 41 42 43 44 45 46 47 48 49 50 51 52 53 54 55 56 57 58 59 60 61 62 63 64 65 66 67 68 69 70 71 72 73 74 75 76 77 78 79 80 81 82 83 84 85 86 87 88 89 90 91 92 93 94 95 96 97 98 99 100 101 102 103 104 105 106 107 108 109 110 111 112 113 114 115 116 117 118 119 120 121 122 123 124 125 126 127 128 129 130 131 132 133 134 135 136 137 138 139 140 141 142 143 144 145 146 147 148 149 150 151 152 153 154 155 156 157 158 159 160 161 162 163 164 165 166 167 168 169 170 171 172 173 174 175 176 177 178 179 180 181 182 183 184 185 186 187 188 189 190 191 192 193 194 195 196 197 198 199 200 201 202 203 204 205 206 207 208 209 210 211 212 213 214 215 216 217 218 219 220 221 222 223 224 225 226 227 228 229 230 231 232 233 234 235 236 237 238 239 240 241 242 243 244 245 246 247 248 249 250 251 252 253 254 255 256 257 258 259 260 261 262 263 264 265 266 267 268 269 270 271 272 273 274 275 276 277 278 279 280 281 282 283 284 285 286 287 288 289 290 291 292 293 294 295 296 297 298 299 300 301 302 303 304 305 306 307 308 309 310 311 312 313 314 315 316 317 318 319 320 321 322 323 324 325 326 327 328 329 330 331 332 333 334 335 336 337 338 339 340 341 342 343 |
# General Parameters # ================== server_ip 192.168.1.200 server_path /var/spool/pandorafms/data_in temporal /tmp logfile /var/log/pandorafms/pandora_agent.log #include /etc/pandora/pandora_agent_alt.conf #broker_agent name_agent # Interval in seconds, 300 by default interval 300 # Debug mode only generate XML, and stop after first execution, # and does not copy XML to server. debug 0 # Optional. UDP Server to receive orders from outside # By default is disabled, set 1 to enable # Set port (41122 by default) # Set address to restrict who can order a agent restart (0.0.0.0 = anybody) # udp_server 0 udp_server_port 41122 udp_server_auth_address 0.0.0.0 # By default, agent takes machine name agent_name serverfacturacion #Parent agent_name #parent_agent_name caprica # Agent description description Servidor web para facturacion y contabilidad # Group assigned for this agent (descriptive, p.e: Servers) group Web # address: Enforce to server a ip address to this agent # You can also try to detect the first IP using "auto", for example address 192.168.1.123 # or setting a fixed IP address, like for example: #address 192.168.36.73 # Autotime: Enforce to server to ignore timestamp coming from this # agent, used when agents has no timer or it's inestable. 1 to enable # this feature #autotime 1 # Timezone offset: Difference with the server timezone #timezone_offset 0 # Agent position paramters # Those parameters define the geographical position of the agent # gis_exec: Call a script that returns a string with a fixed # format of latitude,longitude,altitude # i.e.: 41.377,-5.105,2.365 #gis_exec /tmp/gis.sh # This sets the GIS coordinates as fixed values: # latitude #latitude 0 # longitude #longitude 0 # altitude #altitude 0 #GPS Position description #position_description Madrid, centro # By default agent try to take default encoding defined in host. #encoding UTF-8 # Listening TCP port for remote server. By default is 41121 (for tentacle) # if you want to use SSH use 22, and FTP uses 21. server_port 41121 # Transfer mode: tentacle, ftp, ssh or local transfer_mode tentacle # Server password (Tentacle or FTP). Leave empty for no password (default). #server_pwd mypassword # Set to yes/no to enable/disable OpenSSL support for Tentacle (disabled by default). #server_ssl no # Extra options for the Tentacle client (for example, server_opts "-v -r 5"). #server_opts # delayed_startup defines number of seconds before start execution # for first time when startup Pandora FMS Agent #delayed_startup 10 # Pandora nice defines priority of execution. Less priority means more intensive execution # A recommended value is 10. 0 priority means no Pandora CPU protection enabled (default) #pandora_nice 0 # Cron mode replace Pandora FMS own task schedule each XX interval seconds by the use # of old style cron. You should add to crontab Pandora FMS agent script to use this mode. # This is disabled by default, and is not recommended. Use Pandora FMS internal scheduler # is much more safe #cron_mode # If set to 1 allows the agent to be configured via the web console (Only Enterprise version) remote_config 0 # If set to 1 start Drone Agent's Proxy Mode # proxy_mode 1 # Max number of simmultaneus connection for proxy (by default 10) # proxy_max_connection 10 # Proxy timeout (by default 1s) # proxy_timeout 1 # Number of threads to execute modules in parallel #agent_threads 1 # User the agent will run as #pandora_user root # Enable or disable XML buffer. # If you are in a secured environment and want to enable the XML buffer you # should consider changing the temporal directory, since /tmp is world writable. #xml_buffer 0 # Minimum available bytes in the temporal directory to enable the XML buffer #temporal_min_size 1024 # Secondary server configuration # ============================== # If secondary_mode is set to on_error, data files are copied to the secondary # server only if the primary server fails. If set to always, data files are # always copied to the secondary server. #secondary_mode on_error #secondary_server_ip localhost #secondary_server_path /var/spool/pandorafms/data_in #secondary_server_port 41121 #secondary_transfer_mode tentacle #secondary_server_pwd mypassword #secondary_server_ssl no #secondary_server_opts # Module Definition # ================= # System information # vmstat syntax depends on linux distro and vmstat command version, please check before use it module_begin module_name Carga_CPU module_type generic_data module_interval 1 module_exec vmstat 1 2 | tail -1 | awk '{ print $13 }' module_max 100 module_min 0 module_description Carga CPU (%) module_min_warning 70 module_max_warning 90 module_min_critical 91 module_max_critical 100 module_unit % module_end #Get load average module_begin module_name Carga_CPU_Ultimo_Minuto module_type generic_data module_exec cat /proc/loadavg | cut -d' ' -f1 module_description Media de carga de CPU en el ultimo minuto module_end #Get free memory in MB #module_begin #module_name Memoria_Cache_Libre #module_type generic_data #module_exec free -m | grep buffers/cache | awk '{print $4}' #module_description Memoria cache libre (MB) #module_min_warning 500 #module_max_warning 600 #module_min_critical 100 #module_max_critical 499 #module_unit MB #module_end # Memoria RAM Libre (%) module_begin module_name Memoria_RAM_Libre module_type generic_data module_exec free | grep Mem | awk '{ printf("%.0f", $4/$2 * 100.0) }' module_max 0 module_min 100 module_description Memoria RAM libre (%) module_min_warning 150 module_max_warning 30 module_min_critical 16 module_max_critical 0 module_unit % module_end #Count total number of processes module_begin module_name Numero_Procesos module_type generic_data module_exec ps -A | tail --lines=+5 | wc -l module_description Numero procesos en ejecucion module_min_warning 270 module_max_warning 340 module_min_critical 341 module_max_critical 99999 module_unit procesos module_end # Process information module_begin module_name Servicio_sshd module_type generic_proc module_exec ps -Af | grep sshd | grep -v "grep" | wc -l module_description Servicio sshd module_end # Async data example module_begin module_name Ultimo_Inicio_Sesion module_type async_string module_exec last | head -1 module_description Ultimo usuario que ha iniciado sesion module_end # Module that get the number of cron file # This module uses a precondition, if cron is running the # module will check the folder /etc/cron.d to get the number of files module_begin module_name Numero_Ficheros_Crontab module_type async_string module_precondition =~ .*cron.* ps aux | grep cron module_exec ls -l /etc/cron.d | awk 'NR>1 {print $0}' | wc -l module_description Numero de ficheros crontab module_unit files module_end # Plugin example # This plugin detects all disk partitions and monitor the free spaces #module_plugin pandora_df # This parses /var/log/syslog file, under the module name "syslog" # And search for "ssh" string into it, sending only that information. #module_plugin grep_log /var/log/syslog Syslog ssh # Get disk space free in % / module_begin module_name Espacio_Libre_Disco_root module_type generic_data module_exec df -kh / | tail -1 | awk '{ print 100-$5 }' module_max 100 module_min 0 module_description Espacio libre en disco root / (%) module_min_warning 11 module_max_warning 20 module_min_critical 0 module_max_critical 10 module_end # Get disk space free in % /dev/shm module_begin module_name Espacio_Libre_dev/shm module_type generic_data module_exec df -kh /dev/shm | tail -1 | awk '{ print 100-$5 }' module_max 100 module_min 0 module_description Espacio libre en disco /dev/shm (%) module_min_warning 11 module_max_warning 20 module_min_critical 0 module_max_critical 10 module_end # Get disk space free in % /boot module_begin module_name Espacio_Libre_/boot module_type generic_data module_exec df -kh /boot | tail -1 | awk '{ print 100-$5 }' module_max 100 module_min 0 module_description Espacio libre en disco /boot (%) module_min_warning 11 module_max_warning 20 module_min_critical 0 module_max_critical 10 module_end #This module uses postprocess feature to unit conversion module_begin module_name Memoria_RAM_Usada_MB module_type generic_data module_exec free -k | grep buffers/cache | awk '{print $3}' module_postprocess 0,000976 module_description Used memory in KB postprocessed to be in MB module_end # Plugin for inventory on the agent (Only Enterprise) # module_plugin inventory 1 cpu ram video nic hd cdrom software init_services filesystem users process ip route # Example of preconditions #module_begin #module_name Test Precondicion #module_type generic_data #module_precondition < 10 echo 5 #module_precondition > 10 echo 15 #module_precondition = 10 echo 10 #module_precondition != 10 echo 5 #module_precondition =~ 10 echo 10 #module_precondition (5,15) echo 10 #module_freepercentmemory #module_description Precondition test module #module_end # Example of postconditions #module_begin #module_name Test Postcondicion #module_type generic_data #module_condition < 10 echo min >> /tmp/log.txt #module_condition > 3 echo max >> /tmp/log.txt #module_condition = 5 echo equal >> /tmp/log.txt #module_condition != 10 echo diff >> /tmp/log.txt #module_condition =~ 5 echo regexp >> /tmp/log.txt #module_condition (3,8) echo range >> /tmp/log.txt #module_exec echo 5 #module_description Postcondition test module #module_end |


